
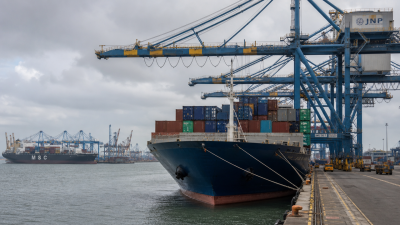
As of 10 July 2026, international data show Indian container ports handled 24 million TEUs in 2025 yet rank below many global peers. Recent throughput and performance indices, plus operational events, expose capacity, efficiency and resilience gaps with direct implications for trade, logistics costs and maritime strategy.
Current status and why it matters
As of now Indian container throughput stood at 24 million TEUs for 2025 while leading ports recorded much larger volumes (Shanghai 55 million TEUs; Singapore 44.6 million TEUs; Ningbo‑Zhoushan 43.8 million TEUs). Mundra ranked 25th and Jawaharlal Nehru Port (JN Port) 26th in global throughput. Colombo ranked 24th ahead of both. JNPA ranked 22nd in the World Bank Container Port Performance Index (CPPI), Pipavav 28th (best private), Mundra 30th, Visakhapatnam 104th. Recent events include severe monsoon disruption at Nhava Sheva and completion of Kamarajar Port’s Phase‑VI dredging (18m draft).
Global ranking and performance analysis
- Throughput gap: Aggregate Indian throughput is substantially lower than top ports; top three each handled nearly double or more of Indian aggregate.
- CPPI signals: JNPA performs relatively better (22nd) but private and state ports show wide variance (Pipavav 28th; Mundra 30th; Visakhapatnam 104th), indicating operational and governance weaknesses.
- Port concentration: Seven carriers control about 74% of container shipping; their network choices shape demand and call patterns for ports.
Key challenges hindering competitiveness
- Infrastructure limits: Shallow drafts at some terminals, insufficient berths for mega‑ships, and constrained yard space reduce handling capacity.
- Connectivity deficits: Inadequate rail and road hinterland links increase inland transit time and transport costs.
- Operational inefficiency: High dwell time, variable crane productivity and labour issues lower throughput per berth. CPPI rankings reflect these operational gaps.
- Climatic and resilience risks: Monsoon disruptions at Nhava Sheva show exposure to extreme weather and insufficient contingency planning.
- Competitive regional dynamics: Nearby transhipment hubs such as Colombo attract calls that India aims to retain or capture.
- Market power of carriers: Dominant liners favour ports that guarantee scale, regular services and fast turnaround, disadvantaging smaller or less predictable ports.
Strategic engagements and international collaborations
- Carrier partnerships: Ports are entering strategic arrangements with global container lines to secure traffic and expertise — examples include MSC at Vizhinjam, Maersk at Pipavav, and CMA/CGM and Hapag‑Lloyd at Mumbai and Tuticorin.
- Private investment and PPPs: Private terminal operators and global terminal groups manage capacity and bring technology, but outcomes depend on transparent commercial terms and regulatory predictability.
- Technical and sustainability support: Collaborations have enabled terminal automation pilots, energy‑efficiency measures and targeted investments in equipment and IT systems.
Influence of major shipping lines
- Market concentration: The seven largest lines (Mediterranean Shipping Co, APM‑Maersk, CMA/CGM, COSCO, Hapag‑Lloyd, ONE, Evergreen) together control ~74% of global container capacity.
- Operational leverage: These carriers determine service strings, port calls and transhipment hubs; ports must offer draft, berth productivity and predictable schedules to attract them.
- Negotiation levers: Ports can attract liners by offering long‑term capacity guarantees, improved hinterland connectivity, competitive tariffs and specialised feeder services.
Economic and trade implications
- Trade costs: Lower port efficiency raises logistics costs, lengthens delivery cycles and reduces export competitiveness.
- Supply‑chain resilience: Operational volatility — from weather or congestion — increases risk for manufacturing and trade flows, affecting FDI decisions linked to export supply chains.
- Regional ambition: India’s aim to become a maritime trade hub requires reversing transhipment leakage and improving service attractiveness for global carriers.
Policy, infrastructure and operational measures — way forward
- Deep‑draft capacity: Complete strategic dredging and maintain deeper operational drafts (example: Kamarajar Port’s 18m draft) to handle fully laden large vessels.
- Terminal modernisation: Scale automation, digital yard management, advanced STS/RTG cranes and productivity KPIs tied to concession terms.
- Hinterland integration: Strengthen rail and road corridors, fast‑track port‑centric logistics parks and integrate with national schemes for multimodal connectivity.
- Regulatory and process reforms: Expand port community systems, single‑window customs and PCS upgrades to cut dwell time and transaction costs.
- Commercial strategies: Use targeted PPPs, long‑term slot agreements with carriers, tariff rationalisation and incentives to attract regular calls and feeder services.
- Operational resilience: Mandate contingency planning for monsoon and extreme weather, improve berth scheduling and shore power/green protocols for climate compliance.
- Human capital and governance: Modernise labour practices through collective bargaining frameworks that permit productivity gains; strengthen port authority oversight and performance benchmarking using CPPI and national metrics.
Model Questions
1. Despite ambitious targets, Indian container ports continue to lag global leaders in throughput and efficiency. Critically analyse the underlying reasons for this performance gap and propose strategies to enhance their global competitiveness. [GS-III: Economic Development]
Indian ports lag due to low aggregate capacity (24M TEUs v. Shanghai 55M), draft and berth constraints, weak hinterland connectivity, higher dwell times, uneven operational metrics (CPPI: JNPA 22nd; Mundra 30th; Visakhapatnam 104th), and limited attraction for large liner calls. Strategy: complete dredging and deep‑water projects, automate terminals, integrate port‑rail‑road corridors, strengthen single‑window customs, expand PPPs with global carriers, and build weather‑resilient operations.
2. Public‑private partnerships and international collaborations are crucial for modernising India’s port infrastructure. Examine how these models are being utilised in the Indian container port sector and their potential for sustainable development. [GS-III: Economic Development]
Public‑private partnerships and carrier collaborations bring capital, technical know‑how and guaranteed cargo streams. Examples: MSC at Vizhinjam, Maersk at Pipavav, CMA/CGM and Hapag‑Lloyd at Mumbai and Tuticorin. They enable green investments, terminal automation and specialised services. Policy must ensure transparent commercial terms, regulatory stability, land and rail connectivity, tariff rationalisation, competitive access for third‑party operators, and clauses for climate adaptation and local workforce development.
3. Analyse the implications of India’s container port performance on its global trade and logistics. What policy reforms and technological advancements are necessary to improve operational resilience and cost‑efficiency of Indian ports? [GS-III: Economic Development]
Weak port performance raises logistics costs, increases lead times and reduces export competitiveness. It constrains supply‑chain resilience during shocks. Reforms: reduce dwell time via port community systems and customs digitisation, adopt PCS‑2.0, implement productivity KPIs, promote port‑centric logistics parks, invest in automation and RTG/STS cranes, expand deep‑draft capacity through dredging, upgrade rail‑road connectivity under national infrastructure schemes, and enforce predictable tariff and labour policies.
4. The global container shipping industry is dominated by a few major players. Discuss the influence of these shipping lines on the strategic development and operational choices of Indian container ports. [GS-III: Economic Development]
Concentration among seven carriers (MSC, APM‑Maersk, CMA/CGM, COSCO, Hapag‑Lloyd, ONE, Evergreen) with 74% market share shapes berth allocation, route choices and investment flows. Ports must offer scale, regular calls and competitive turnaround. Responses: negotiate strategic long‑term contracts, develop transhipment and feeder networks, improve draft and crane productivity, offer tariff predictability, and pursue alliances that align port development with carrier network strategies.
Last Modified: July 10, 2026