The floods that inundated North Bihar in 2024 were not an aberration. They were part of a familiar cycle that shapes livelihoods, housing choices, and survival strategies across the region. What made the 2024 floods different, however, was not just their scale but the lens through which their impacts were studied. A household-level flood loss assessment by Megh Pyne Abhiyan, supported by Tata Trusts, exposes critical blind spots in how floods are measured — and how policy responds.
The 2024 floods: scale and setting
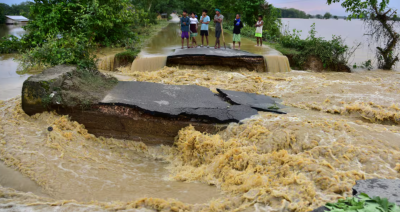
In late September 2024, intense rainfall across North Bihar and adjoining parts of Nepal led to embankment breaches, swollen rivers, and acute drainage congestion. Major river systems — including the Gandak, Bagmati, Kosi, and Mahananda — crossed danger levels, triggering Phase 2 of the floods. By then, 27 districts across Bihar had been affected.
Flooding took multiple forms: breach-induced inundation, flash floods trapped between embankments, and prolonged waterlogging in low-lying areas. These variations mattered enormously for how damage unfolded on the ground.
Why household-level assessment matters
Conventional flood assessments typically count damaged houses, submerged crops, and breached embankments. What they miss is how losses vary across households, locations, and social groups. The Megh Pyne Abhiyan study addressed this gap by surveying 2,290 households across 134 wards in 21 panchayats spanning seven districts.
Using participatory flood mapping, focus group discussions, key informant interviews, and spatial analysis, the assessment captured granular realities that aggregate figures often conceal — particularly the uneven distribution of losses and vulnerability.
The true cost of flooding
Across surveyed households, total reported economic losses amounted to roughly ₹126.3 crore. Land damage alone accounted for nearly half of this figure, making it the single largest loss category. Housing damage was the most widespread impact, affecting close to 2,000 households and imposing heavy repair and reconstruction costs.
Everyday losses — kitchen utensils, stored food, furniture, sanitation materials — were common, as were agricultural damages. While these items contributed less in monetary terms, their loss disrupted daily life and recovery. The average loss per household stood at ₹5.51 lakh, but the median was much lower at ₹2.11 lakh, indicating that a small number of households suffered catastrophic losses while many others faced moderate but destabilising damage.
Flood typology and spatial blind spots
The type of flooding shaped outcomes decisively. Breach-induced floods caused the highest overall losses, while flash floods between embankments led to extremely high losses for fewer households. These findings challenge the assumption that embankments uniformly protect surrounding populations.
Indeed, 58% of surveyed households were located in rural areas, many between or outside embankments. Despite decades of structural flood control, these zones remained highly vulnerable during Phase 2 of the floods. The lesson is stark: embankments often redistribute flood risk rather than eliminate it.
Inequality and the vulnerability paradox
An important insight from the assessment concerns inequality. Households from the general category reported higher absolute monetary losses than Scheduled Caste and Scheduled Tribe households. But lower losses did not translate into lower vulnerability.
For poorer households with minimal assets and savings, even modest damage was difficult to absorb. This “assessment-based vulnerability paradox” shows why monetary loss alone is an inadequate measure of suffering. The same flood shock deepens inequality by pushing already vulnerable households into longer and more precarious recovery paths.
How households coped
Flood impacts extended far beyond physical damage. Most households reported cutting food consumption, relying on stored grain, borrowing from relatives or neighbours, or depending on remittances. Displacement was widespread, and distress sales — mortgaging jewellery, livestock, or even land — were common.
Insurance penetration was negligible. Most households were either unaware of flood-related insurance or unable to access existing schemes, leaving them exposed to repeated shocks.
Institutional response and community knowledge
While disaster management mechanisms were activated, households reported short warning times, uneven relief distribution, and limited involvement of local self-government institutions. Yet communities themselves demonstrated deep understanding of flood behaviour and practical solutions.
Suggestions included locally available boats, raised and flood-resilient housing, dedicated cattle shelters, community-managed water and sanitation systems, grain banks, flood-tolerant crops, mobile health and veterinary services, and locally operated early warning systems.
What this means for flood governance
The policy message is clear. Flood governance cannot remain focused on water levels and damaged assets alone. It must account for differentiated vulnerability, social inequality, and household recovery capacity.
Household-level assessments provide precisely this missing evidence. They reveal how floods redistribute risk, intensify hardship, and shape long-term resilience. For North Bihar — where floods are recurrent and climate variability is rising — policy must shift from managing water to managing vulnerability.
What to note for Prelims?
- Major flood-prone rivers of North Bihar.
- Limitations of conventional flood damage assessments.
- Role of community-based flood mapping.
What to note for Mains?
- Why embankment-centric flood control has limited effectiveness.
- Concept of differentiated vulnerability in disasters.
- Importance of household-level data for disaster governance.
- Link between floods, inequality, and recovery pathways.