
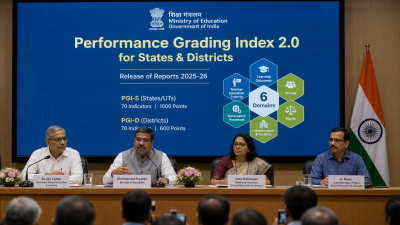
On 7 July 2026 the Ministry of Education released the Performance Grading Index 2.0 (PGI‑S for States/UTs and PGI‑D for Districts) for 2025–26. The Indian school system reported 14.67 lakh schools, 1.03 crore teachers and 24.72 crore students.
PGI‑2.0: scope and structure
- PGI‑S: 70 indicators across six domains; total weight 1,000 points; two broad categories — Outcome and Governance & Management.
- PGI‑D: 70 indicators organised into 11 domains across six categories; total weight 600 points; district‑level outcome emphasis.
Methodology and data sources
- Primary data: UDISE+, PARAKH Rashtriya Sarvekshan 2024, PM POSHAN Portal, PRABANDH Portal, Vidyanjali Portal.
- Scoring: Indicator‑level metrics aggregated to composite scores and mapped to graded bands (Utkarsh, Uttam‑1, Uttam‑2, Uttam‑3, Prachesta‑1, etc.).
2025–26 key findings
- Top performer: Chandigarh scored 766/1,000 and is the only UT in Uttam‑3 overall.
- Overall grades: No State/UT attained Utkarsh, Uttam‑1 or Uttam‑2 in 2025–26.
- Prachesta‑1 band: Dadra & Nagar Haveli and Daman & Diu, Punjab, Kerala, Delhi in 51–60% range.
- Distribution: All States/UTs scored above 50% for the first time; gap between top and bottom narrowed from 51% (2017–18) to 31.4% (2025–26).
- Learning outcomes: Persist as weakest area; only Punjab reached Uttam‑3 in this domain; no State/UT in top three learning outcome grades.
IASPOINT Booster Facts
- Comparability: Common 70‑indicator framework for State and District editions allows alignment of system‑level and district‑level diagnostics.
- Policy use: Designed to inform targeted interventions and resource allocation in school education planning.