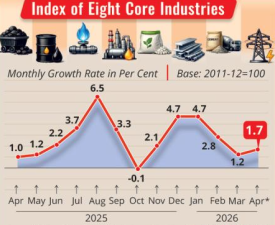
India’s eight core infrastructure industries grew by 1.7% in April 2026 compared to the same month last year. Higher production in the steel, cement, and electricity sectors supported this growth. Conversely, output dropped across the coal, crude oil, natural gas, refinery products, and fertilizer sectors. These eight core industries carry a combined weight of 40.27% in the Index of Industrial Production (IIP), acting as a primary indicator of broader macroeconomic health. For the full financial year 2025-26, the core sector recorded a cumulative growth rate of 2.7%, down from 4.5% in the previous fiscal year.
Overview of the Index of Eight Core Industries
The Index of Eight Core Industries (ICI) evaluates the collective and individual production performance of foundational sectors in the economy. It is a production volume index that tracks physical output rather than financial turnover.
Institutional Framework and Release Cycle
- Compiling Authority: The index is compiled and released by the Office of the Economic Adviser (OEA) under the Department for Promotion of Industry and Internal Trade (DPIIT), Ministry of Commerce and Industry.
- Frequency and Timing: It is released on the last working day of every month with a time lag of one month. This release occurs approximately twelve days before the compilation of the broader industrial index.
- Base Year Alignment: The current series operates with 2011-12 as the base year, which matches the base year used for calculating national accounts and manufacturing indices.
Weightage Distribution in the Basket
The components of the index are weighted based on their share within the industrial basket. The inter-se weights show the varying impact each industry has on economic activity.
| Sector | Weightage in IIP (%) |
| Petroleum Refinery Products | 28.04 |
| Electricity Generation | 19.85 |
| Steel Production | 17.92 |
| Coal Production | 10.33 |
| Crude Oil Production | 8.98 |
| Natural Gas Production | 6.88 |
| Cement Production | 5.37 |
| Fertilizers Production | 2.63 |
| Total Core Sector Weight | 40.27 |
Sectoral Performance Dynamics
The core industries function as basic inputs for downstream industrial activities. Performance trends in these individual sectors reveal localized economic constraints or expansions.
Growth Drivers in early 2026
- Steel and Cement: Driven by state-led capital expenditure in infrastructure and real estate developments, both sectors maintained an upward trajectory. Steel expanded by 9.5% and cement grew by 8.7% over the course of the preceding financial year.
- Electricity Generation: Power demand rose due to expanding domestic cooling requirements and industrial operations, registering a steady 1.0% expansion in the 2025-26 fiscal timeline.
Underperforming Segments and Contractions
- Fossil Fuel Group: Coal production dropped by 8.7% in April 2026, while crude oil and natural gas extractions faced structural declines due to maturing domestic aging fields.
- Refinery and Fertilizers: Both sectors witnessed marginal contractions at the start of the fiscal year, primarily influenced by routine maintenance shutdowns at processing plants and fluctuations in imported raw feedstock costs.
Linkage with the Index of Industrial Production
The core index serves as a lead indicator for the wider manufacturing environment. Fluctuations within these eight fields directly shift the broader industrial indices.
Statistical Correlation
The National Statistical Office (NSO), operating under the Ministry of Statistics and Programme Implementation (MoSPI), compiles the comprehensive manufacturing data. The IIP is divided into three broader sectors: Mining, Manufacturing, and Electricity. Core items are distributed across these classes. For example, coal and crude oil fall under mining, refinery products and steel under manufacturing, and power generation under electricity.
IASPOINT Booster Facts for UPSC
- Formula Used: The Index of Eight Core Industries is calculated using the Laspeyre’s fixed-base formula, which measures the percentage change in quantity over time relative to the base period.
- Historical Evolution: The index originally tracked six industries with 1980-81 as the base year. Natural gas and fertilizers were added later during the 2004-05 base series revision.
- Refinery Products Dominance: Petroleum refinery products hold the maximum individual weightage (28.04%), meaning performance changes in oil refining heavily influence the movement of the entire core index.
- Fertilizer Sector Nuance: Fertilizers carry the lowest weightage (2.63%) but fluctuate significantly based on seasonal agricultural demands, minimum support prices, and monsoon timelines.
- Lead Indicator Value: Because the core index data releases nearly two weeks before the full IIP reports, policymakers use it to forecast short-term economic momentum and plan interventions.