
The Multidimensional Poverty Index (MPI) marks a paradigm shift from traditional income-based poverty estimation to a deprivation-based approach. It recognizes that poverty is not just a lack of money but a simultaneous experience of multiple deprivations, such as poor health, lack of education, and inadequate living standards.
- Global Origin: The Global MPI was launched in 2010 by the Oxford Poverty and Human Development Initiative (OPHI) and the United Nations Development Programme (UNDP) for the Human Development Report.
- Methodology: It utilizes the Alkire-Foster (AF) method, which identifies people as “multidimensionally poor” based on the intensity of deprivations they face across various indicators.
- Identification Threshold: Globally, an individual is considered MPI poor if they are deprived in one-third (33.3%) or more of the weighted indicators.
National Multidimensional Poverty Index (NMPI) by NITI Aayog
In India, NITI Aayog is the nodal agency for the National MPI. While it aligns with the global methodology, it is customized to suit India’s specific public policy priorities.
- Data Source: The National MPI primarily relies on the National Family Health Survey (NFHS). The baseline report used NFHS-4 (2015-16), while subsequent updates utilize NFHS-5 (2019-21).
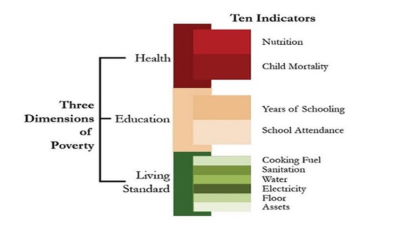
- Dimensions: It retains the three original dimensions—Health, Education, and Standard of Living—but expands the number of indicators to provide a more granular view of the Indian context.
Dimensions and Indicators of National MPI
The Indian National MPI evaluates 12 indicators. Each of the three dimensions carries an equal weight of 1/3. The individual indicators within a dimension share the weight of that dimension equally.
| Dimension | Indicators (Total 12) | Weight | Deprivation Criteria (Simplified) |
| Health | Nutrition | 1/6 | Any adult or child is undernourished. |
| Child & Adolescent Mortality | 1/12 | Any child/adolescent died in the family in the last 5 years. | |
| Antenatal Care (ANC) | 1/12 | At least 4 ANC visits not completed or non-institutional delivery. | |
| Education | Years of Schooling | 1/6 | No member has completed six years of schooling. |
| School Attendance | 1/16 | Any school-age child is not attending school. | |
| Standard of Living | Cooking Fuel | 1/21 | Uses wood, charcoal, dung, or coal for cooking. |
| Sanitation | 1/21 | No improved toilet or shared toilet with other households. | |
| Drinking Water | 1/21 | No access to safe drinking water or water is >30 mins walk. | |
| Electricity | 1/21 | No electricity connection in the household. | |
| Housing | 1/21 | Floor, roof, or walls are made of rudimentary materials. | |
| Assets | 1/21 | Does not own more than one of: Radio, TV, Phone, Bike, etc. | |
| Bank Accounts | 1/21 | No household member has a bank or post office account. |
Statistical Measures in MPI
To provide a holistic view, the MPI is calculated using two primary components:
- Headcount Ratio (H): The proportion of the population that is multidimensionally poor. It answers “How many are poor?”
- Intensity of Poverty (A): The average proportion of deprivations experienced by the poor. It answers “How poor are the poor?”
- MPI Value: Calculated as the product of the Headcount Ratio and the Intensity of Poverty (MPI = H × A).
Trends and Findings from India’s National MPI (NFHS-5)
The second edition of the National MPI (released in 2023) highlighted significant progress in poverty reduction across the country.
- Reduction in Poverty: India’s multidimensional poverty headcount ratio declined from 24.85% (2015-16) to 14.96% (2019-21).
- Number of People Relieved: Approximately 13.5 crore people escaped multidimensional poverty between 2015-16 and 2019-21.
- Rural vs. Urban: Rural areas saw the fastest decline in poverty (from 32.59% to 19.28%), while urban poverty dropped from 8.65% to 5.27%.
- State-wise Performance:
- Bihar remains the state with the highest percentage of MPI poor, followed by Jharkhand and Meghalaya.
- Uttar Pradesh registered the largest decline in the absolute number of poor people.
- Kerala continues to have the lowest headcount ratio in the country.
Significance of MPI for Policy Making
- Targeted Interventions: MPI allows policymakers to identify specific sectors (e.g., sanitation or nutrition) where a particular district or state is lagging.
- Complementary to GDP: It provides a human-centric view of development that GDP growth rates might mask.
- SDG Monitoring: MPI is a critical tool for tracking progress toward Sustainable Development Goal (SDG) Target 1.2, which aims to reduce at least by half the proportion of men, women, and children living in poverty in all its dimensions.
Key Trivia for UPSC Prelims
- MPI vs. HCR: While the traditional Headcount Ratio (HCR) only looks at income/expenditure, MPI looks at “overlapping deprivations.”
- Nodal Agency: NITI Aayog’s Multidimensional Poverty Index Coordination Committee (MPICC) includes members from various ministries to ensure data synergy.
- Global Rank: In the Global MPI 2023, India was recognized as one of the countries that successfully halved its MPI value within 15 years (2005/06 to 2019/21).
- The “33.3% Rule”: In the National MPI, a person is multidimensionally poor if their deprivation score is 33.3% or higher. If the score is between 20% and 33.3%, they are considered “Vulnerable to Multidimensional Poverty.”