
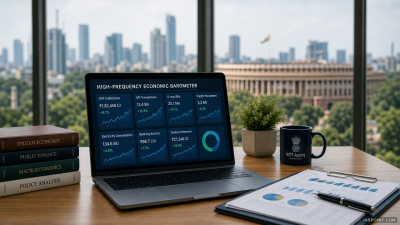
The Government of India is scheduled to launch the High‑Frequency Economic Barometer in New Delhi on 14 July 2026. The Confederation of All India Traders has welcomed the initiative. The barometer will combine GST, UPI, e‑way bills, freight, electricity, banking and digital commerce data to provide near‑real‑time economic signals.
What is the High‑Frequency Economic Barometer?
Short‑interval composite index that integrates daily, weekly and monthly administrative and digital transaction series to track economic activity in near real time. Key component streams include GST collections, UPI transactions (NPCI), e‑way bills, freight movement, electricity consumption, bank transaction and credit flows, and digital commerce metrics.
Why it matters for governance and the economy
Provides early warning on demand shocks, supply‑chain disruptions and inflationary pressures. Enables faster policy calibration by central and state agencies. Supplies timely actionable signals for fiscal, monetary and sectoral interventions prior to the release of quarterly GDP and other lagged series.
Composition and data architecture
- Administrative tax data — GST collections and e‑way bills provide receipts and goods movement information under the GST regime.
- Payments and finance — UPI volumes and bank credit/deposit flows indicate consumption and liquidity trends.
- Logistics — Freight movement and e‑way penetration track supply‑chain throughput.
- Utilities and demand — Electricity consumption serves as a proxy for industrial and household activity.
- Digital commerce — Platform sales and transaction counts reflect retail and services demand in the formal digital economy.
Macroeconomic stabilisation and predictive policy use
High‑frequency indicators reduce information lags. Policymakers can detect turning points in consumption, production or logistics earlier than with traditional series. Practical uses:
- Monetary policy inputs — near‑term demand signals to refine inflation outlook and liquidity operations.
- Fiscal management — real‑time revenue and expenditure implications to adjust targeted relief or stimulus.
- Supply interventions — rapid identification of bottlenecks for logistics support, buffer releases or regulatory easing.
- Scenario forecasting — nowcasts and short‑run projections to bridge gaps until official GDP releases.
Federal governance and administrative challenges
- Inter‑governmental data sharing — many indicators require state‑level inputs (electricity, local commerce); co‑ordination through the GST Council and central ministries is essential.
- Digital infrastructure gaps — uneven internet penetration and digital transaction uptake across states bias coverage.
- Standards and metadata — need uniform definitions, time stamps and formats to ensure comparability and aggregation.
- Capacity building — state statistical offices and line departments require training and systems for timely, high‑quality reporting.
Impact on MSMEs, traders and retailers
MSMEs (under the Micro, Small and Medium Enterprises Development Act, 2006), small traders and retailers can use real‑time insights to manage inventory, working capital and price strategies. Authorities can deploy targeted credit, supply support and market intelligence to locations showing demand weakness. The barometer can function as an early warning system for localised stress among small firms.
Methodological and structural limitations
- Informal sector exclusion — metrics based on GST, UPI and bank flows underrepresent households and firms outside formal channels.
- Short‑term volatility and seasonality — daily/weekly series are sensitive to festivals, weather and one‑off events; careful seasonal adjustment and filtering are required.
- Selection bias — platform or bank‑specific data may not reflect the entire economy unless broadly sourced.
- Privacy and legal safeguards — integrating private transaction data mandates anonymisation, explicit legal frameworks and cybersecurity measures.
Comparison: high‑frequency indicators versus traditional indicators
| Dimension | High‑frequency indicators | Traditional indicators |
|---|---|---|
| Timeliness | Daily/weekly/monthly | Quarterly/annual |
| Coverage | Formal, transaction‑based segments | Broader structural coverage including surveys |
| Use in policy | Nowcasts, early warnings, operational response | Strategic planning, structural assessment |
| Main risk | Short‑term noise, bias from formalisation | Reporting lag, lower frequency |
Policy responses and implementation roadmap
- Hybrid modelling — combine high‑frequency series with household and enterprise surveys to offset informal sector gaps and assess structural change.
- Standardisation protocol — central authorities should issue metadata standards and common time stamps; involve the NSSO, MOSPI and Reserve Bank where relevant.
- Expand digital public infrastructure — improve rural broadband, payments access and digital literacy to broaden data representativeness.
- Data governance — adopt anonymisation, data minimisation and legal safeguards to protect privacy; establish an oversight mechanism for access and audit trails.
- Periodic recalibration — revise indicator weights and inclusion criteria to reflect shifts in payment behaviour, formalisation and sectoral structure.
Model Questions
1. Evaluate the role of real‑time data in modern macroeconomic policy formulation. How can the High‑Frequency Economic Barometer assist in identifying structural changes and inflationary pressures early? [GS-III: Economic Development]
Real‑time data reduces informational lags and supports nowcasting. The barometer tracks GST, UPI, electricity and freight, enabling early detection of demand shifts and supply constraints that signal inflationary trends. To identify structural change, combine high‑frequency signals with survey data and firm‑level indicators, monitor persistent deviations across series, and recalibrate weights to separate transitory shocks from lasting shifts in consumption or production patterns.
2. Discuss the administrative and federal challenges in implementing real‑time data‑driven governance in India. Suggest institutional measures for cooperative implementation. [GS-II: Governance]
Challenges include uneven digital infrastructure, heterogeneous data standards, limited state capacity and inter‑jurisdictional data sharing barriers. Institutional measures: empower GST Council and a central data‑coordination unit, issue uniform metadata standards, fund state capacity building, set SLAs for data provision, and create legal frameworks for secure data exchange with audit and access controls to preserve federal balance and data quality.
3. Analyse the potential of high‑frequency economic barometers to mitigate market risks and supply‑chain disruptions affecting MSMEs and retailers. [GS-III: Economic Development]
High‑frequency signals offer timely market intelligence for inventory and cash‑flow decisions. They help identify regional demand dips or logistics bottlenecks so authorities can target credit, supplier relief or transport measures. For MSMEs, integration with credit schemes and district‑level dashboards can enable rapid, localised support. Limitations persist where MSMEs operate outside digital channels; complementary outreach and formalisation incentives are necessary.
4. While high‑frequency indicators offer rapid insights, they cannot fully replace traditional survey‑based structural indicators. Critically examine the strengths and limitations of both approaches. [GS-III: Economic Development]
High‑frequency indicators provide immediacy, operational signals and nowcasts but suffer from coverage bias, seasonal noise and informal sector omission. Survey‑based indicators capture employment, poverty and long‑term structural variables but are lagged and costly. A combined framework is required: use high‑frequency data for short‑run policy and surveys for structural diagnosis, with defined protocols for integration and periodic recalibration.
Last Modified: July 13, 2026