
The scientific consensus on climate change is supported by a multi-decadal accumulation of evidence ranging from direct atmospheric measurements to the analysis of ancient geological records.
Global Temperature and Heat Content
Surface Temperature Anomalies
Direct measurements of atmospheric temperature provide the most immediate evidence of a warming planet.
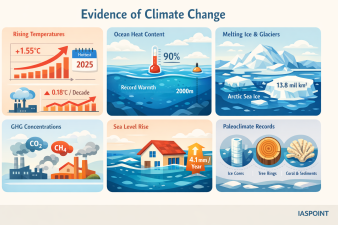
- Recent Records: Data from 2024 confirmed it as the warmest year on record, with global mean near-surface temperatures approximately 1.55°C above the pre-industrial (1850–1900) average.
- 2025 Trends: Preliminary data for 2025 indicates it is likely to be the second or third warmest year, continuing a streak of ten consecutive record-breaking years.
- Historical Context: The Earth’s temperature has risen at an average rate of 0.08°C per decade since 1880; however, this rate has more than doubled to 0.18°C since 1981.
Ocean Heat Content (OHC)
The World’s oceans act as a massive heat sink, absorbing over 90% of the excess heat trapped in the Earth’s system.
- Measurement: Heat content is measured in Zettajoules (ZJ). The upper 2,000 meters of the ocean have warmed significantly, with 2024 and 2025 setting consecutive new records for OHC.
- Impact: This thermal expansion is a primary driver of sea-level rise and fuels more intense tropical cyclones (e.g., increased Frequency of Category 4 and 5 storms).
Cryospheric Degradation
Glacial Retreat and Ice Sheet Mass Loss
The cryosphere (frozen water) is the most sensitive indicator of climate change.
- Glacier Mass Balance: The hydrological year 2023/2024 was the third consecutive year of record net mass loss for global reference glaciers.
- Ice Sheets: The Greenland and Antarctic ice sheets are losing mass at an accelerated pace. Greenland’s ice loss is currently a larger contributor to sea-level rise than Antarctica’s.
- Arctic Sea Ice: In March 2025, Arctic sea-ice extent reached its annual maximum of 13.8 million km², the lowest maximum extent in the satellite record.
Permafrost Thawing
Permafrost—ground that remains frozen for at least two consecutive years—is thawing in the Siberian and Arctic tundras.
- Methane Feedback: Thawing releases trapped methane (CH4), a greenhouse gas with a global warming potential 28–36 times higher than CO2 over a 100-year period.
Atmospheric Composition and Chemistry
Greenhouse Gas (GHG) Concentrations
The Keeling Curve (Mauna Loa Observatory) provides the longest continuous record of atmospheric CO2.
- Carbon Dioxide (CO2): Concentrations reached 423.9 ppm in 2024, a 53% increase from pre-industrial levels (278 ppm).
- Methane (CH4): Current levels are approximately 260% of pre-industrial levels, primarily due to wetlands, agriculture, and fossil fuel leaks.
- Nitrous Oxide (N2O): Primarily from agricultural soil management, it stands at roughly 125% of pre-industrial levels.
Ocean Acidification
As the ocean absorbs roughly 30% of anthropogenic CO2, it undergoes a chemical reaction that reduces pH levels.
- pH Shift: Global surface ocean pH has dropped from 8.2 to 8.1 since the Industrial Revolution.
- Acidity Increase: This 0.1 unit drop represents a 30% increase in acidity, as the pH scale is logarithmic.
- Biological Impact: Acidification reduces the availability of carbonate ions (CO32-), essential for calcifying organisms like corals and mollusks.
Sea Level and Hydrological Changes
| Indicator | Current Observation (2025-2026 Data) | Primary Driver |
| Global Mean Sea Level (GMSL) | Rate of rise has doubled from 2.1 mm/yr (1993-2002) to 4.1 mm/yr (2016-2025). | Thermal expansion + Meltwater from glaciers/ice sheets. |
| Extreme Precipitation | Significant increase in “atmospheric river” events and flash droughts. | Clausius-Clapeyron relation (Warmer air holds more moisture). |
| Marine Heatwaves | Over 90% of the ocean surface experienced at least one heatwave in 2024. | Direct absorption of solar radiation. |
Paleoclimatological Proxies (Long-term Evidence)
Since direct instrumental records only date back to the mid-19th century, scientists use “proxies” to reconstruct past climates.
- Ice Cores: Trapped air bubbles in Antarctic ice (like the Vostok or EPICA cores) provide a record of atmospheric composition going back 800,000 years.
- Tree Rings (Dendroclimatology): The width and density of annual rings indicate past temperature and precipitation levels.
- Coral Skeletons: The ratio of oxygen isotopes (18O/16O) in coral calcium carbonate reveals past sea surface temperatures.
- Ocean Sediments: Foraminifera (microscopic organisms) shells in sediment cores provide data on ancient ocean chemistry and temperatures.
Key UPSC Facts for Prelims
- IPCC AR6: The Sixth Assessment Report states it is “unequivocal” that human influence has warmed the atmosphere, ocean, and land.
- Critical Tipping Points: These include the collapse of the West Antarctic Ice Sheet, the shutdown of the Atlantic Meridional Overturning Circulation (AMOC), and the dieback of the Amazon rainforest.
- India’s Status: In the Climate Change Performance Index (CCPI) 2026, India ranks 23rd, categorized as a medium performer due to its continued reliance on coal despite ambitious renewable energy targets.