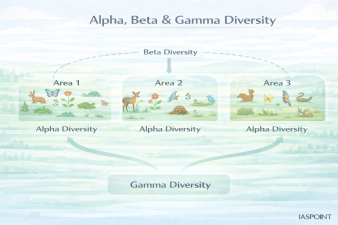
In 1972, ecologist Robert Whittaker introduced a nested hierarchy to measure biodiversity across different spatial scales. These metrics—Alpha, Beta, and Gamma diversity—allow conservationists and ecologists to quantify species richness and the turnover of species across landscapes.
1. Alpha (α) Diversity: Local Diversity
Alpha diversity refers to the diversity within a particular area or a single ecosystem. It is the most basic level of diversity measurement.
- Focus: The number of species (species richness) and their relative abundance (evenness) in a specific habitat.
- Measurement: Usually calculated by counting the number of taxa (typically species) within a defined ecosystem (e.g., a single pond, a specific forest patch, or a single field).
- Significance: It tells us how “rich” a specific location is but does not provide information on how that location compares to others.
2. Beta (β) Diversity: Species Turnover
Beta diversity measures the change in species composition (the “turnover”) between two or more ecosystems or along environmental gradients.
- Focus: It quantifies the difference in species richness between adjacent ecosystems.
- Mathematical Concept: If two ecosystems have exactly the same species, the Beta diversity is low. If they have entirely different sets of species, the Beta diversity is high.
- Significance: High Beta diversity indicates that the region has a wide variety of distinct habitats, each supporting unique species. It helps in identifying unique habitats that require specific conservation efforts.
- Example: Comparing the bird species found in a mangrove forest versus those found in an adjacent tropical rainforest.
3. Gamma (γ) Diversity: Regional Diversity
Gamma diversity represents the total species richness across an entire large landscape or a geographical region.
- Focus: It is the overall diversity of a large area that encompasses multiple ecosystems (e.g., the entire Western Ghats, the Himalayan range, or the state of Kerala).
- Relationship: It is a product of the Alpha diversity of individual patches and the Beta diversity (degree of difference) between those patches.
- Significance: It provides a “macro” view of biodiversity, useful for national-level conservation planning and identifying Biodiversity Hotspots.
Comparative Summary
| Level | Scale | What it Measures | UPSC Context / Example |
| Alpha (α) | Local | Number of species in one specific habitat. | The number of tree species in one hectare of Silent Valley. |
| Beta (β) | Comparison | The rate of change in species between habitats. | The difference in species between the Silent Valley forest and the nearby Shola grasslands. |
| Gamma (γ) | Regional | Total diversity of the entire landscape. | The total number of species across the entire Western Ghats. |
Key Factors Influencing Diversity Scales
Environmental Gradients
Beta diversity often increases along environmental gradients, such as changes in altitude, moisture, or soil pH. As the environment changes, one set of species is replaced by another.
Habitat Fragmentation
When a large continuous habitat is broken into fragments, Alpha diversity within fragments may decrease, but Beta diversity might temporarily increase as different fragments begin to support different species (though overall Gamma diversity often declines due to extinctions).
Latitude and Altitude
- Latitude: Generally, Alpha and Gamma diversity decrease as one moves from the Equator to the Poles.
- Altitude: Diversity usually peaks at mid-elevations (Mid-domain effect) and decreases at very high altitudes.
UPSC Prelims Trivia: Species Evenness vs. Richness
- Species Richness: Simply the count of species.
- Species Evenness: How close in numbers each species in an environment is.
- Scenario: Forest A has 100 Tigers and 1 Deer. Forest B has 50 Tigers and 50 Deer.
- Result: Both have the same Richness (2 species), but Forest B has higher Evenness and is considered more “diverse” in many ecological indices.