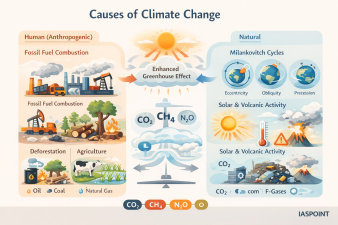
The causes of climate change are categorized into natural internal processes and external forcings, with anthropogenic (human-induced) activities now recognized as the “unequivocal” primary driver of modern warming.
Anthropogenic Causes: The Enhanced Greenhouse Effect
Human activities have significantly increased the atmospheric concentration of Greenhouse Gases (GHGs), trapping more heat than is naturally required to sustain life.
Fossil Fuel Combustion
The burning of coal, oil, and natural gas remains the largest single source of global emissions.
- Energy Sector: Responsible for approximately 75-80% of total CO2 emissions. In India, thermal power (coal-based) still accounts for over 50% of installed capacity as of 2026.
- Transport: Contributes roughly 14% of global emissions. Road transport is the dominant sub-sector, though aviation and shipping are the fastest-growing sources.
- Industrial Processes: Beyond energy use, industries like Cement and Steel release CO2 as a chemical byproduct. Cement production alone accounts for 5-8% of global CO2 emissions.
Land-Use Change and Deforestation
Forests act as carbon sinks; their destruction turns them into carbon sources.
- Biomass Burning: Clearing land for palm oil, soy, or cattle ranching releases stored carbon instantly.
- Reduced Sequestration: The loss of nearly 10 million hectares of forest annually globally diminishes the Earth’s capacity to absorb CO2.
Agricultural and Waste Practices
Non-CO2 gases from these sectors often have higher Global Warming Potentials (GWP).
- Enteric Fermentation: Livestock (cattle, sheep) produce significant Methane (CH4) during digestion.
- Rice Cultivation: Anaerobic decomposition in flooded paddy fields is a major methane source, particularly relevant for India.
- Synthetic Fertilizers: The use of nitrogen-based fertilizers releases Nitrous Oxide (N2O), which has a GWP 273 times that of CO2.
- Landfills: Decomposing organic waste in landfills generates methane, especially in urban clusters.
Individual Greenhouse Gas Profiles (2026 Data)
| Greenhouse Gas | 2026 Concentration (Est.) | GWP (100-year) | Primary Anthropogenic Source |
| Carbon Dioxide (CO2) | ~429.4 ppm | 1 | Fossil fuel use, Deforestation |
| Methane (CH4) | ~1,942 ppb | 28–36 | Wetlands, Livestock, Rice, Gas leaks |
| Nitrous Oxide (N2O) | ~338.0 ppb | 273 | Agriculture (Fertilizers), Industry |
| Fluorinated Gases (F-gases) | Traces | 1,000–24,000 | Refrigeration, GIS (SF6), Electronics |
Natural Causes: Long-term and Short-term Variability
While human influence is dominant today, natural factors historically governed Earth’s climate cycles.
Milankovitch Cycles (Orbital Forcing)
These represent variations in Earth’s orbit that occur over tens of thousands of years.
- Eccentricity: Changes in the shape of Earth’s orbit (circular vs. elliptical) on a 100,000-year cycle.
- Obliquity (Tilt): Changes in the angle of Earth’s axis (between 22.1° and 24.5°) every 41,000 years, affecting seasonal intensity.
- Precession (Wobble): The “wobble” of Earth’s axis on a 26,000-year cycle, changing the timing of seasons relative to the orbit.
Solar and Volcanic Forcing
- Solar Cycles: Changes in solar radiation (sunspot activity) occur on an 11-year cycle, though their net impact on current warming is negligible compared to GHGs.
- Volcanic Eruptions: While volcanoes release CO2, major eruptions (e.g., Mt. Pinatubo) primarily cause short-term cooling (1–3 years) by injecting sulfur aerosols into the stratosphere, which reflect sunlight.
Short-Lived Climate Forcers (SLCFs)
These agents have a high warming impact but remain in the atmosphere for a very short time.
- Black Carbon (Soot): Produced by incomplete combustion (diesel engines, biomass burning). It absorbs solar energy directly and reduces the albedo (reflectivity) of snow and ice, accelerating melting in the Himalayas and Arctic.
- Tropospheric Ozone (O3): Formed by the reaction of sunlight with pollutants (NOx, VOCs). It acts as a potent GHG and damages crop yields.
Trivia for UPSC Prelims
- Global Warming Potential (GWP): A measure of how much energy the emissions of 1 ton of a gas will absorb over a given period, relative to 1 ton of CO2.
- The “Green GIS” Shift: In 2026, India’s Central Electricity Authority (CEA) recommended phasing out Sulfur Hexafluoride (SF6)—the most potent GHG (GWP 24,000+)—from the power grid in favor of clean air or vacuum-based insulation.
- Keeling Curve: The graph showing the ongoing change in concentration of carbon dioxide in Earth’s atmosphere since 1958.